Leveraging your Citrix Current Release investment – Director Style

Tracking changes to Citrix Director in CR streams
- Intro
- Feature List
- Pre 1906 Wins
- 1906: Session Auto Reconnect
- 1906: Session startup duration
- 1906: Desktop probing
- 1903: Citrix Profile Management Duration in Profile Load
- 1903: Minor user interface change
- 1903: New features guide
- 1811: Logon Performance – Profile Drilldown
- 1811: Microsoft RDS license health
- 1811: Hypervisor alerts monitoring
- 1811: Key RTOP Data display
- 1811: Application Probing access through Citrix Gateway
- 1808: Export of Filters data
- 1808: Logon Performance – Interactive session drill-down
- 1808: Logon Performance – GPO drill-down
- 7.18: Application probing
- 7.18: Built-in alert policies
- 7.18: Health Assistant link
- 7.18: Interactive Session drill-down
- 7.17: PIV smartcard authentication support
- 7.16: Applications Analytics
- 7.16: Access Monitor Service data using Version 4 of the Odata API
- 7.16: Shadow Linux VDA user sessions
- 7.16: Older Site version indication
- 7.16: Support for domain local group
- 7.16: Access to machine console
Intro
I originally posted this article under the CUGC community site here.
For customers on the Current Release path for Citrix Virtual Apps and Desktops, one of the best features available to you is the ever-growing list of cool stuff that Director Introduces.
Feature List
A few features that I find have not gained enough love given how important and awesome they are, are listed below with some real life data against them:
Profile Management Drill Down
No kidding, as I was writing this post I was working with a customer who just upgraded to 1906 from LTSR 7.15. Their profile load times (showing at 40 seconds for one user), took about 5 seconds in Director to identify the problem. Two guesses as to what was going wrong…
Interactive Session breakdown and Drill Down
Interactive session drill downs are one of the most elusive and frustrating components to troubleshoot in an environment as It’s like a dirty pit of doom where all the nasties seem to land. We now have a bit more ability to drill down and identify the specific components within the Interactive Logon as per below.
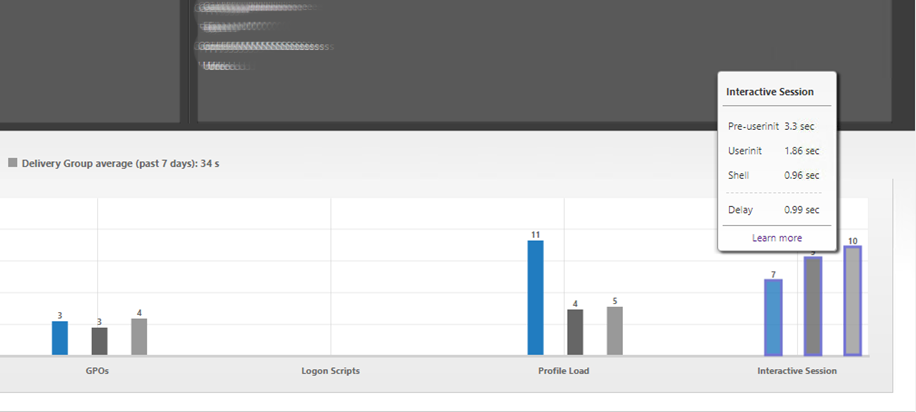
By default, the detail below looks good, however it isn’t quite functioning as one would expect as we are missing the break out of the shell and Userinit phases.
Interactive Session Drilldown without process auditing: 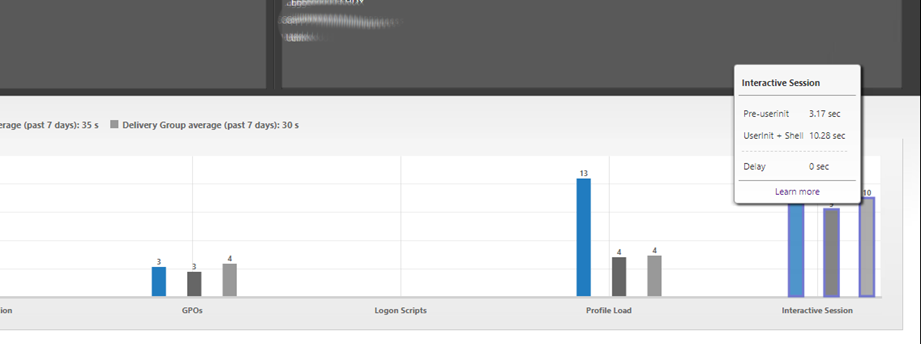
The trick here is to enable process audit tracking on the VDA’s via Group Policy:
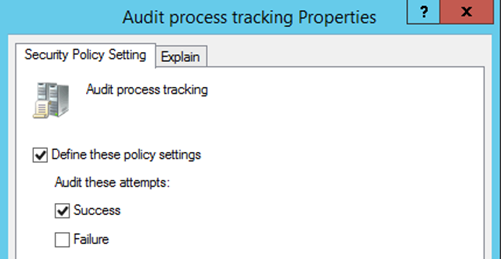
Once in play we can see the appropriate breakout of Shell and Userinit:
Client-Side Extension Breakdown and Drill Down
This is a huge win and something I am quite passionate about – the identification and annihilation of rubbish CSE (Client-Side Extension) problems – typically Group Policy Preferences and Folder Redirection. Previously we have had to leverage tools like Control Up’s Analyze Logon Duration Analysis PowerShell based SBA written by the ridiculously clever Guy Leech, however we now have this data visibility on the fly via Director natively – very cool.
Below we can see a session showing a 47 second logon duration (nasty):
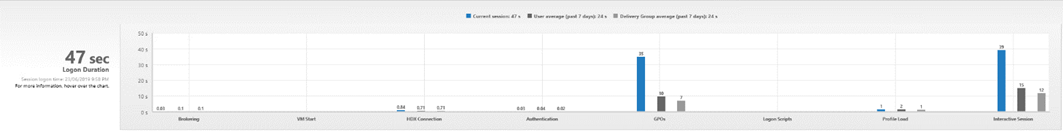
it doesn’t take long to drill down and identify that Group Policy Drive Maps are to blame for this horrible crime:

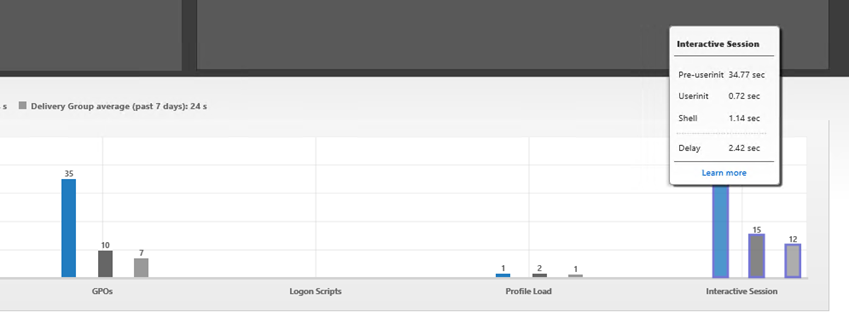
And when we drill down into detailed information, we can see exactly which policy is to blame:
What I am really impressed about is that the phases are accurately lining up these days, we can see that dodgy CSE extensions and GPO processing are having a direct hit on the Interactive Session times:
Fix the offending policy, and the results are obvious:
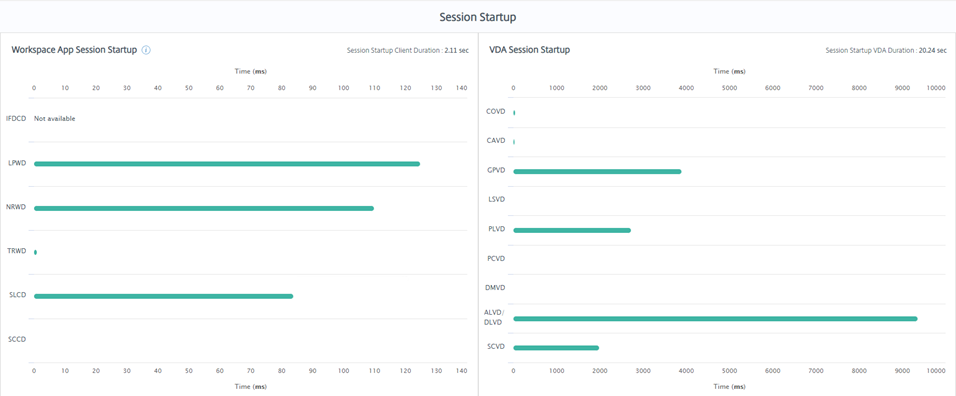
Session Startup Analysis
The new session startup analysis breakdown is extremely impressive. Not just are we monitoring how long it takes to log on, but now we have a breakdown into how long it took the actual session to establish and where the delays where – Dodgy DNS, Dodgy Active Directory, Dodgy ICA file generation – all things that are typically invisible yet directly impact the user perceived logon times are not provided in a single pane of glass. Extremely impressive progress
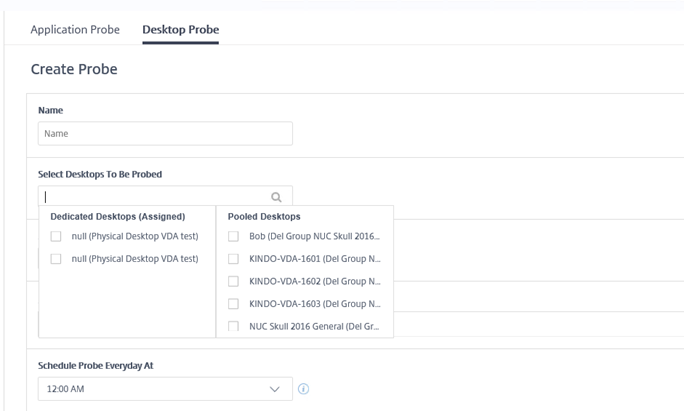
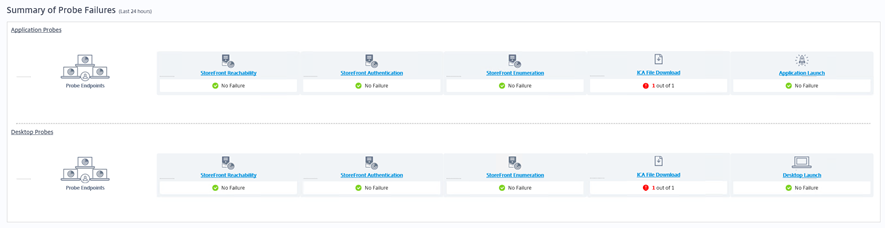
Desktop and Application probing
A proactive mindset vs a reactive mindset is often the make or break difference for teams managing EUC platforms. If you can see a problem before it hits your user based, then you are well and truly ahead of the game. There are entire toolsets available in the industry to put you ahead of the game entirely, however for platinum or cloud customers, Application and Desktop probing is available to you out of the box, allowing for a basic session launch of key applications or desktops, and appropriate alerting and reporting should these fail. Proactive fun at its best
A really cool byproduct of this technology is that you actually have a tool that can not just monitor of sessions will launch, but also an out of the box native capability to address the first session of the day logon lag. I previously wrote a script utilizing the free (and awesome) Control Up Logon Simulator to address this which successfully runs in numerous environments with success, now you have a tool that is in build to achieve the same – Probe the machine (ha!), perform the logon, confirm the health and warm up that VDA for the next user. Win. Win. Win
Pre 1906 Wins
It can be hard to keep up with the amount of development work and feature releases that come out with each CR release, so below is a nice listing of all features since the LTSR 7.15 release:
1906: Session Auto Reconnect
The Sessions page on the Trends tab now includes information about the number of auto reconnects. Auto reconnects are attempted when the Session Reliability or Auto Client Reconnect policies are in effect.
The auto reconnect information helps you view and troubleshoot network connections having interruptions, and also analyze networks having a seamless experience.
The drilldown provides additional information like Session Reliability or Auto Client Reconnect, time stamps, Endpoint IP, and Endpoint Name of the machine where the Workspace app is installed. This feature is available for Citrix Workspace app for Windows, Citrix Workspace app for Mac, Citrix Receiver for Windows, and Citrix Receiver for Mac.
This feature requires Delivery Controller version 7 1906 or later, and VDAs 1906 or later.
For more information, see:
- Sessions
- Auto client reconnect policy settings
- Session reliability policy settings
- Session Auto Reconnect
1906: Session startup duration
Director now displays the session startup duration divided into Workspace App Session Startup and VDA Session Startup time periods. This data helps you to understand and troubleshoot high session startup duration. Further, the time duration for each phase involved in the session startup helps in troubleshooting issues associated with individual phases. For example, if the Drive Mapping time is high, you can check if all the valid drives are mapped properly in the GPO or script.
This feature is available on Delivery Controller version 7 1906 or later and VDAs 1903 or later.
For more information, see Diagnose session startup issues.
1906: Desktop probing
This feature automates health checks of virtual desktops published in a Site, thereby improving the user experience. To initiate desktop probing, install and configure the Citrix Probe Agent on one or more endpoint machines. Desktop probing is available for Premium licensed Sites.
This feature requires Delivery Controller(s) version 7 1906 or later and Citrix Probe Agent 1903 or later.
For more information, see Desktop Probing
1903: Citrix Profile Management Duration in Profile Load
Director now includes profile processing duration in the Profile Load bar of the Logon duration chart. This is the duration Citrix Profile Management takes to process user profiles. This information helps administrators to troubleshoot high profile load durations with greater accuracy.
For more information, see Profile Load
1903: Minor user interface change
The user interface in the Trends page contains some minor changes to the appearance – for example the hover text appears in a higher contrast in the details list. Similar changes will be rolled out over coming releases to improve the user experience and rendering speed
1903: New features guide
Director now has an in-product guide that gives an insight into the new features released in the cur- rent version of Director. The quick overview coupled with appropriate in-product messages helps you understand what’s new in the product.
For more information, see New Features Guide
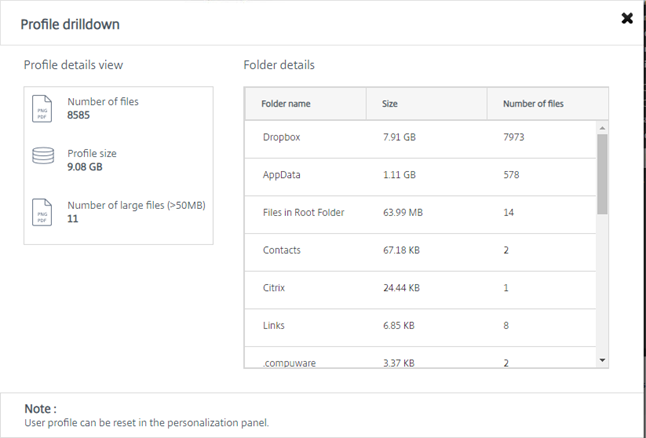
1811: Logon Performance – Profile Drilldown
The Logon Duration panel in the User Details pages now includes information on the Profile load phase drill down of the logon process. Profile Drilldown provides useful information about user pro- files for the current session that can help administrators troubleshoot high profile load issues. A tool tip with the following user profiles information is displayed:
- Number of files
- Profile size
- Number of large files
A detailed drill down provides information about the individual folders, their size, and the number of files. This feature is available on Delivery Controller version 7 1811 or later and VDAs 1811 or later. For more information, see Diagnose user logon issues
1811: Microsoft RDS license health
Director now displays the Microsoft RDS (Remote Desktop Services) license status on the Machine Details panel in the Machine Details and the User Details page for Server OS machines. An appropriate message is displayed for the license status. You can hover over the info icon to see further details.
For more information, see the Microsoft RDS license health section in Troubleshooting Machines
1811: Hypervisor alerts monitoring
Director now displays alerts to monitor hypervisor health. Alerts from Citrix Hypervisor and VMware vSphere are supported. Hypervisor alerts help monitor the following states/parameters:
- CPU usage
- Memory usage
- Network usage
- Hypervisor connection unavailable
- Disk usage (vSphere only)
- Host connection or power state (vSphere only)
Hypervisor alerts monitoring is available for Premium licensed Sites.
This feature requires Delivery Controller version 7 1811 or later. If you are using an older version of Director with the latest version of the Site, only the hypervisor alert count is displayed. To view the alerts, upgrade Director.
For more information, see the Hypervisor alerts monitoring section in Alerts and Notifications
1811: Key RTOP Data display
Director now displays key RTOP (RealTime Optimization Pack) 2.6 data in the HDX panel of the User Details page. This helps monitor the following status of the RTOP pack for each user:
- Status (optimized,fallback)
- RTC version
- RTME version on user device
- Packet loss metrics
This feature requires Delivery Controller(s) 7 1811 or later, and VDA 1808 or later
1811: Application Probing access through Citrix Gateway
You can now use Director’s Application probing feature to probe Citrix Virtual Apps from anywhere. You can use this flexibility to run the Citrix Application Probe Agent on end point machines that are hosted in a different network.
You can access the Site you want to probe through the Citrix Gateway. To do this, while configuring the Citrix Application Probe Agent, type the Citrix Gateway URL in the StoreFront URL field. Citrix Gateway automatically routes the request to the corresponding Site StoreFront URL.
This feature is available for Citrix Gateway version 12.1 or later, and Delivery Controller(s) 1811 or later.
For more information about Application probing setup, see Application probing.
1808: Export of Filters data
You can now export real-time monitoring data in the Filters tab to CSV format files. The export feature is available from the Machines, Sessions, Connections, and Application Instances Filters pages. You can select a predefined custom filter or select suitable filter criteria, choose required columns in the table, and export the data. Data of up to 100,000 records can be exported. The exported CSV files give a comprehensive view of the real-time data, and help ease analysis of large data sets.
This feature is available on Delivery Controller version 7 1808 or later and VDAs 1808 or later.
For more information, see Filter data to troubleshoot failures
1808: Logon Performance – Interactive session drill-down
The Logon Duration panel in the User and Session Details view includes information on the Interactive Session phase of the logon process. The time taken for each of the three subphases (Pre-userinit, Userinit, and Shell) is displayed in the Interactive Session bar as a tooltip. This provides more granular troubleshooting and remediation of this phase of the logon. The cumulative time delay between the subphases and a link to the documentation is also provided.
This feature is available on Delivery Controller version 7 1808 or later and VDAs 1808 or later. The Interactive Session drilldown bar shows the time duration for the current session only.
For more information, see Diagnose user logon issues
1808: Logon Performance – GPO drill-down
The Logon Duration panel in the User and Session details view contains the GPO (Group Policy Objects) duration. This is the total time taken to apply the GPOs on the virtual machine during the logon process. Now, you can see the drill-down of each policy applied as per CSEs (Clients-Side Extension) as a tool tip in the GPO bar. For each policy application, the drill-down displays the status and the time taken.
This additional information eases troubleshooting and remediation of issues involving high GPO duration. The time durations in the drilldown represent the CSE processing time only and do not add up to the total GPO time.
This feature is available on Delivery Controller version 7 1808 or later and VDAs 1808 or later.
For more information, see Diagnose user logon issues
7.18: Application probing
This feature automates health-checks of XenApp and XenDesktop applications published in a Site, thus improving the user experience. To initiate application probing, install and configure the Citrix Application Probe Agent on one or more endpoint machines.
In Director’s Configuration page, configure the applications to be probed, the endpoint machines to run the probe on, and the probe time. The agent tests the launch of selected applications using StoreFront and reports back the results to Director.
The probe results are displayed on the Director UI – the last 24-hours’ data in the Applications page and historical probe data in the Trends > Application Probe Results page. Here, you can see the stage when the probe failure occurred – StoreFront Reachability, StoreFront Authentication, StoreFront Enumeration, ICA download, or Application launch. The failure report is emailed to the configured addresses.
You can schedule your application probes to run during off peak hours across multiple geographies. The comprehensive results can help to proactively troubleshoot issues related to provisioned applications, hosting machines or connections before the users experience them.
Application probing is available for Platinum licensed Sites.
This feature requires Delivery Controller(s) version 7.18 or later.
For more information, see Application Probing.
7.18: Built-in alert policies
Director now has a set of built-in alert policies for Delivery Groups and Server OS VDAs scope. These policies are displayed in the Director > Citrix Alerts Policy page. Alert notifications are generated on the breach of the default threshold values predefined for these alerts. The threshold values ensure basic optimal performance parameters in the Site and can be edited. The built-in alert policies are created when there is at least one alert target – a Delivery Group or a Server OS VDA defined in your Site.
In case you upgrade your Director instance and your Site, the alert policies from your previous Director instance are carried over. Built-in alert policies are created only if no alert rules for the policies exist in the Monitor database.
This feature requires Delivery Controller(s) version 7.18 or later.
For more information, see Alerts and Notifications
7.18: Health Assistant link
The Machine Details page of an unregistered machine in the Monitoring console now contains a Health Assistant button. Currently, the button links to the Troubleshoot machines article and to the Knowledge Center article Citrix Health Assistant – Troubleshoot VDA Registration and Session Launch where you can download the tool.
The Citrix Health Assistant tool helps troubleshoot configuration issues in unregistered VDAs. The tool automates a number of health checks to identify possible root causes for common VDA registration, session launch, and time zone redirection configuration issues
7.18: Interactive Session drill-down
The Logon Duration panel in the User Details view includes information on the Interactive Session stage of the logon process. To provide more granular troubleshooting and remediation of this phase of the logon, Interactive Session now has three sub-phases: Pre-userinit, Userinit, and Shell. In this release, hovering over Interactive Session displays a tooltip showing the sub-phases and a link to the documentation.
For a description of the sub-phases and how to improve the performance of each phase, see Diagnose user logon issues
7.17: PIV smartcard authentication support
Apart from the form based and Integrated Windows authentication of users, Director now supports Personal Identity Verification (PIV) based smart card authentication. This feature is useful for organizations and government agencies that use smart card based authentication for access control.
To log on to Director, insert your smart card into the smart card reader, and enter your smart card token. After you are authenticated, you can access Director without having to provide additional credentials on the Director logon page.
For more information on the configuration required for smart card based authentication, see Configure PIV smart card authentication.
For more information on using Director with smart card based authentication, see the Use Director with PIV based smart card authentication section in the Director article
7.16: Applications Analytics
You can now analyze and monitor the performance of applications efficiently with the new Application Analytics page available from the Applications tab in Director. The page provides a consolidated view of the health and usage of all applications published on your Site. It shows metrics such as the number of instances per application, and faults and errors associated with the published applications. This feature requires Delivery Controller Version 7.16 or later and VDAs Version 7.15 or later.
For more information, see the Application Analytics section in Troubleshooting Applications
7.16: Access Monitor Service data using Version 4 of the Odata API
Create your customized monitoring and reporting dashboards based on the Monitor Service data by using the Odata V.4 endpoint. Odata V.4 is based on the ASP.NET Web API and supports aggregation queries and other improvements. Running aggregation queries improves server-side performance. The ASP.NET Web API fully supports the REST protocol, enabling Monitor Service consumers to use the fully REST-compliant interface Odata query
7.16: Shadow Linux VDA user sessions
You can now shadow user sessions running on Linux VDA machines. Shadowing is available for sessions on Linux VDAs Version 7.16 and later running the RHEL7.3 or Ubuntu 16.04 Linux distributions. noVNC is used to connect and view Linux VDA sessions from Director. This extension of the shadowing feature helps administrators to troubleshoot issues on Linux VDAs efficiently.
For more information, see Shadow users
7.16: Older Site version indication
The latest features and updates supported in an upgraded Director version are available only if you also upgrade the Site. If your Delivery Controller is an earlier version than Director, the Director console displays a message indicating the mismatch.
For more information, see Feature compatibility matrix
7.16: Support for domain local group
You can now add users from other forests into a domain local group,and then use the domain local group for user assignment to XenApp and XenDesktop Delivery Groups. Director is now upgraded to show the session details of such users. This feature is useful for Citrix Service Provider administrators, to troubleshoot users belonging to a tenant forest by using domain local groups to hold the tenant user or user group records.
For more information, see Domain local group configuration in Advanced configuration
7.16: Access to machine console
The Machine Details panel in Director now provides access to consoles of machines hosted on the XenServer hypervisor version 7.3. You can now troubleshoot issues in VDAs directly from Director. This feature requires Delivery Controller(s) Version 7.16 or later.
For more information, see Machine Console access in Troubleshoot machines
Just another good reason to be on CR really. Enable your teams!